
This paper introduces the requirements for electric vehicle shock absorbers through a comparative study of two pure electric vehicles from different brands under actual road conditions. In this investigation, the focus is placed on shock absorbers, which are the suspension components most closely related to ride comfort. Different shock absorber designs are used for research on vehicles and test benches. The analysis results in both the time domain and frequency domain are presented in the paper.
01 Introduction
Electric vehicles (EVs) have opened up new perspectives for consumers and set higher quality standards for automobiles. Here, vibration comfort has the greatest impact on vehicle owners’ perception of automotive quality. The level of ride comfort acceptable for traditional vehicles now creates an impression of poor quality for EV passengers. Therefore, reducing unnecessary vibrations and noise in EV chassis development has become increasingly critical. Although EV development has reached a relatively mature stage, the vibration characteristics of chassis systems have not been fully studied.
The following unique characteristics of EVs represent the challenges faced:
※ Changes in sprung and unsprung masses due to electric motors/batteries.
※ Different ride dynamics achieved through electric powertrains and braking energy recovery.
※ Higher demands for shock absorption in terms of wheel natural frequencies (in the case of hub motors) and body natural frequencies, as well as wheel stiffness (due to increased vehicle weight from batteries).
※ A greater tendency to use lightweight materials and composite materials.
Current challenges for automakers and suppliers include:
(1)What new requirements/objectives exist for ride comfort in EVs?
(2)Can these objectives be achieved through traditional chassis component designs?
02 Chassis Vibration Analysis
The growing demand for ride comfort in electric vehicles (EVs) necessitates an integrated consideration of the chassis and optimization of its various components and parts. This represents a complex vibration system with nonlinear characteristics, random excitation forces, and transient vibration processes. Individual disturbing vibrations complained about by vehicle passengers only occur under specific operating conditions, such as vehicle load, road profile, vehicle speed, etc. Therefore, measuring the vehicle under actual operating conditions is the most effective method to reproduce and examine chassis vibrations.
Operational measurements include test drives on public roads, primarily involving random wheel excitation. To further analyze the interrelationships between chassis components, measurements were also conducted when driving over defined obstacles (speed bumps) on a test track. To demonstrate the potential for optimizing vibration behavior, in addition to the original production shock absorbers, design-optimized shock absorbers were installed and subjected to the same measurements. At the conclusion of the investigation, all shock absorbers underwent dynamic measurements on a test bench to evaluate individual components.
03 Description of Test Routes and Test Vehicles
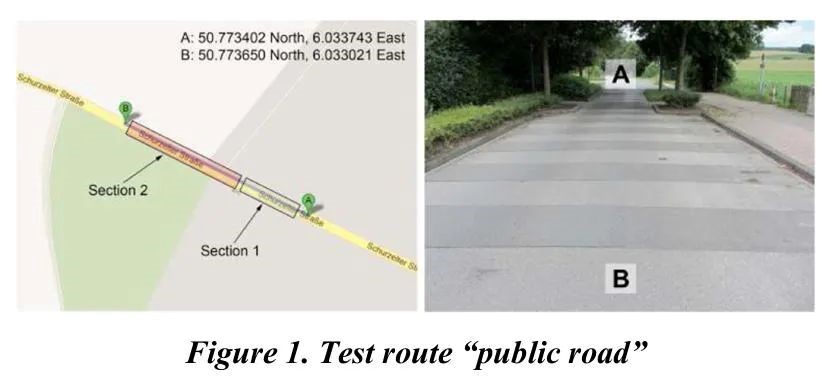
Special attention was paid to the selection of suitable measurement routes. Conducting measurements on specially selected public roads offers numerous advantages, such as appropriate excitation amplitudes, realistic driving conditions, and an environment where end consumers evaluate their vehicles’ vibration comfort. For these reasons, a public road near the city of Aachen was chosen, and two relevant road sections with a total length of approximately 70 meters were defined for testing:
Section 1 – Noisy Section with Excitation: Composed of roads where vehicles travel over potholes, recesses, and transverse joints.
Section 2 – Smooth Section without Excitation: Composed of roads with flat surfaces and no significant obstacles.
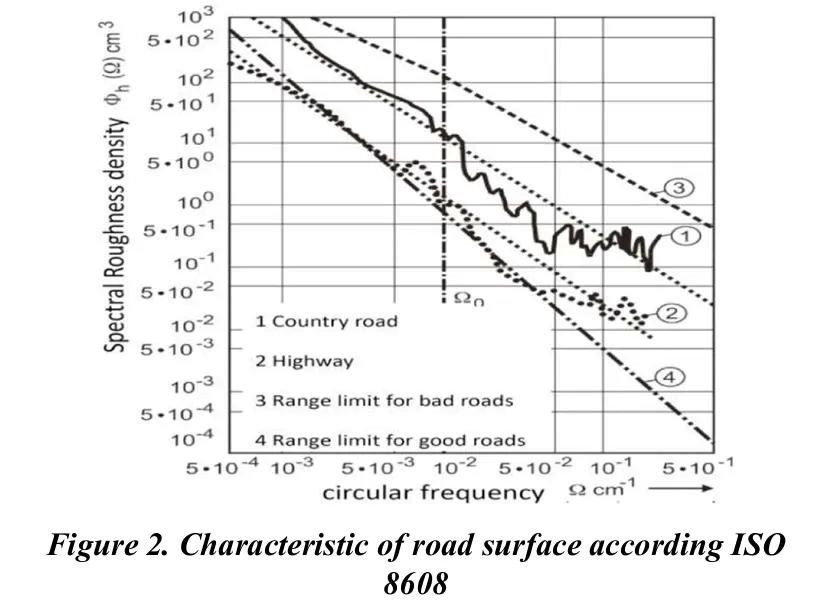
The excitation curves for bench testing can be derived from three-dimensional digital images and used to measure the noise of shock absorbers. The relevant roads were scanned using a pavement measurement vehicle (ika), and the unevenness was subjected to spectral analysis according to ISO 8608 standards. In Figure 2, the spectral roughness density of the “good” and “bad” road evaluation thresholds is presented above the circular frequency.
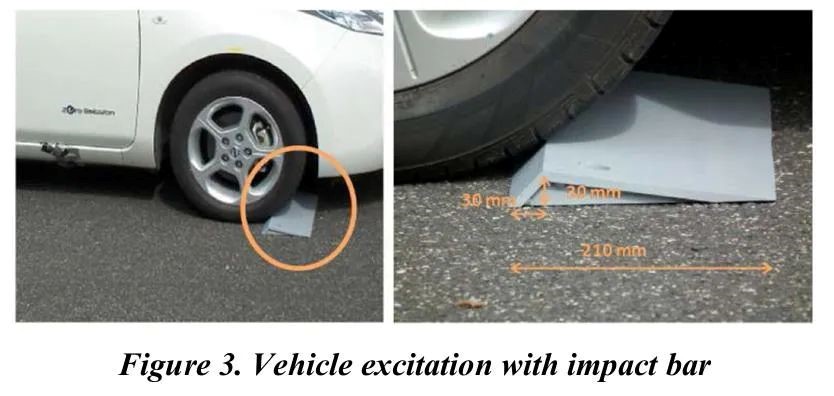
Measurements were conducted at the ika RWTH test track in Aachen when passing through individual obstacles (asymmetric speed bumps, as shown in Figure 1). The vehicle’s passage over the obstacle induces impulsive excitations in the wheel in the Z-direction (vertical) and longitudinal direction. Measurements were performed only in the front/rear axle direction on the right side of the vehicle.
As test vehicles, two production pure electric vehicles belonging to the small or compact category were selected. Both vehicles are equipped with traditional spring-shock absorber systems and do not use hub motor drives. Therefore, these chassis are comparable to those of conventionally powered vehicles in the small and compact car category. The technical specifications of the two vehicles are compared below (see Table 1).
04 Experimental Analysis Setup
4.1. Road Measurements
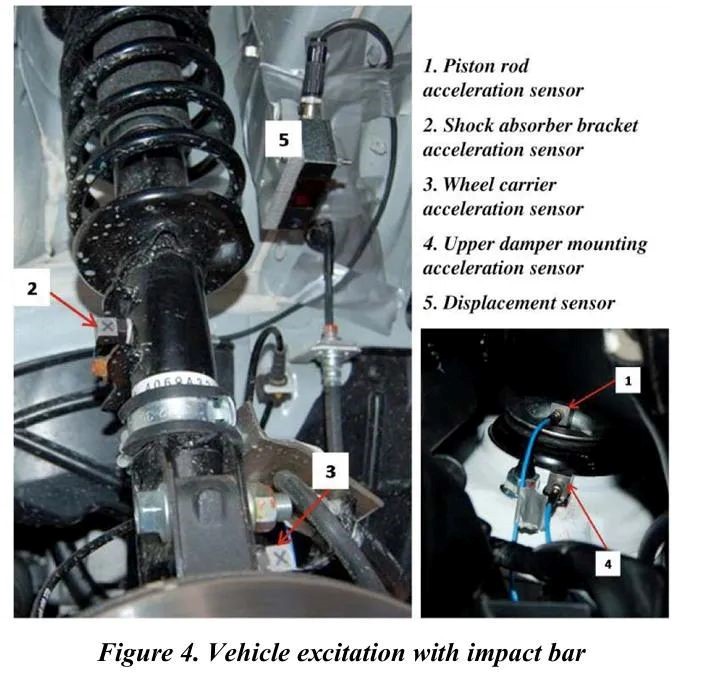
To analyze vibration conditions, the test vehicles were equipped with acceleration sensors. For recording airborne noise, a microphone was positioned at the driver’s right ear, and a binaural artificial head was placed on the front passenger seat. Three-axis acceleration sensors were installed on the shock absorbers (piston rods and shock absorber fluid reservoirs), steering knuckles, as well as shock absorber mounts and driver seat rails. Additionally, a potentiometer was used to measure shock absorber displacement. Figure 4 illustrates an example of sensor applications. To reproduce measurements, a light barrier was installed along the measurement route, with data acquisition triggered by these signals. The vehicles traveled along the defined route at constant speeds of 20 and 30 km/h in both driving directions. Subsequently, signals in the time domain and frequency domain were analyzed. In the frequency analysis, a so-called relative method was employed, which “searches” for signal changes within time and frequency ranges. Background noise was suppressed, making time-varying chassis vibrations more detectable. The frequency spectrum displays relevant components over time.
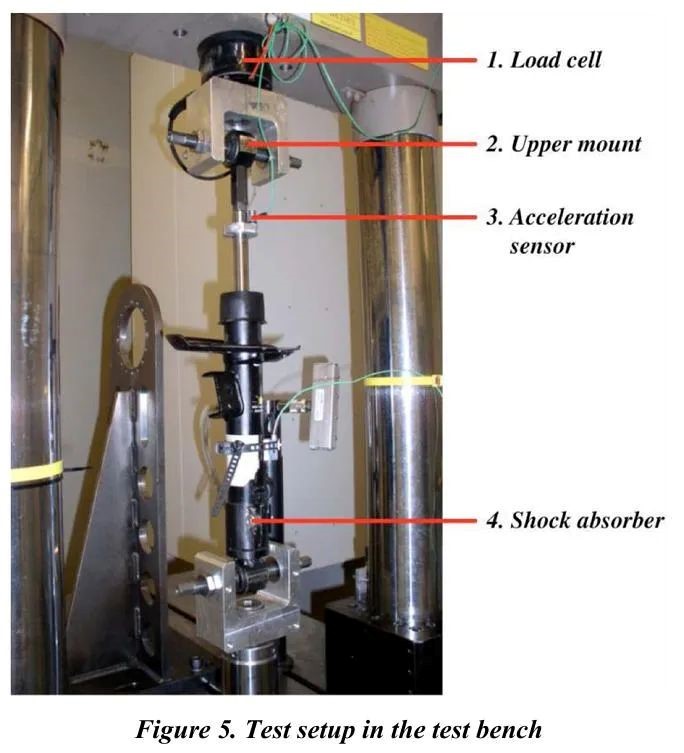
4.2 Bench Measurements of Shock Absorbers High-dynamic measurements were conducted on a servo-hydraulic testing system. The shock absorber was installed at the center of the total stroke of the testing machine (see Figure 5), with the bottom (mount) and top (piston rod) connected. The connection to the piston rod was achieved via a standard rubber joint or through a vehicle-like mount. Piston rod acceleration was measured using actuator displacement and force signals, with an acceleration sensor mounted at the upper end of the piston rod. A test cycle with continuous operating sequences was employed, where excitation frequency and amplitude were varied to test the full operating range of the shock absorber. Peak-to-peak values of piston rod acceleration were determined for both compression and rebound directions. The time history of the measured signals over time characterizes the shock absorber’s vibration behavior and allows experts to compare different valve system setups and design versions.
05 Measurement Results
5.1 Analysis of Disturbance Vibration and Noise Sources
The measurements of the front axle of Vehicle 1 on Section 1 (bumpy road) and Section 2 (smooth road) were analyzed. Figure 6 shows the average frequency spectra of accelerations at the shock absorber (piston rod and shock absorber mount) and the upper shock absorber mount across the entire test road surface.
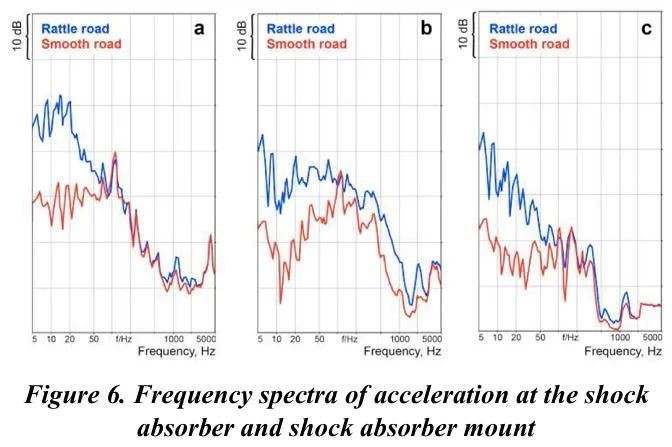
As shown in Figure 6a, the shock absorber mount is significantly vibrated by road profiles within the frequency range below 50 Hz. This low-frequency excitation of the shock absorber generates high-frequency vibrations due to its nonlinear force characteristics. The nonlinearity (degenerative behavior) of the damping force originates from two regions inside the shock absorber: the pressure relief area and the valve area. Figure 6b displays the frequency spectrum of the piston rod acceleration, with the main components falling within the natural frequency range of the piston rod mass when the upper shock absorber mount acts as a spring. In most applications, these frequencies range from 150 to 500 Hz. The vibration of the piston rod excites the mounting dome, which also exhibits higher vibration amplitudes at these frequencies (Figure 6c). The vehicle body acts as a “speaker” here, converting vibrational excitation into audible air noise, which is perceived by vehicle occupants as varying degrees of harsh rattling.
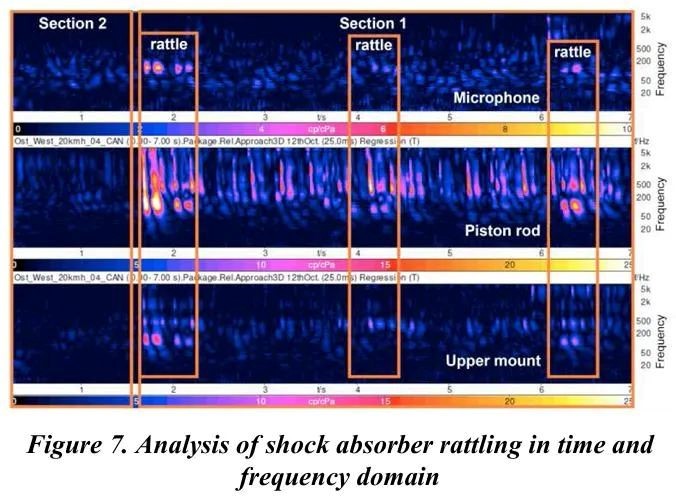
Figure 7 shows a portion of a seven-second vehicle measurement to explain this mechanism. The noise event is displayed within the box labeled “rattling”. Time is plotted along the x-axis, and frequency along the y-axis. The frequency spectrum was calculated using the relative method. The noise appears as low-frequency rattling sounds in the 200 to 600 Hz frequency range, with sound pressure amplitudes showing how piston rod vibrations propagate into airborne noise through the mounting dome. Comparing the frequency spectra of interior noise with excitation (Section 1) and without excitation (Section 2) provides important insights. In the low-to-mid frequency range, level differences of up to 30 dB are achieved, representing a significant discrepancy compared to conventionally powered vehicles. This greater distinction between background noise and noise/vibration implies a notable increase in chassis prominence, which correlates well with subjective evaluations (particularly for Vehicle 1).
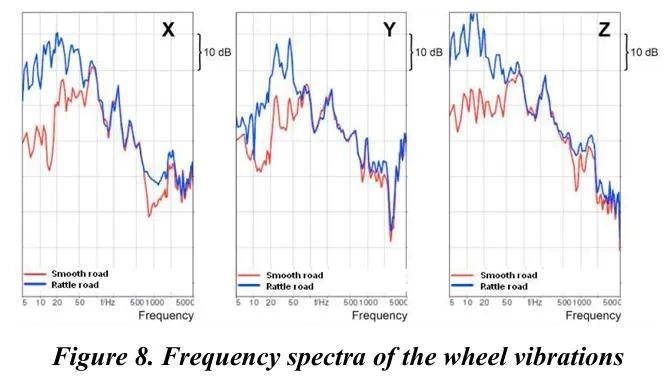
Analysis of tire vibrations shows that when driving on bumpy roads, the amplitude of wheel natural frequencies can reach up to 20 dB (Figure 8). The vibrations in the z-direction (vertical direction) are particularly significant. This excitation is transmitted through the connection points on the vehicle body and transferred to vehicle occupants as unpleasant vibrations (measured on the seat rails in this case).
5.2 Comparison of Measurement Results Between Two Vehicles Both vehicles adopted similar measurement setups and were tested under comparable conditions during test drives. For evaluating shock absorber noise, mechanical vibration signals at the piston rod and upper mount were used. The air noise levels recorded by a microphone positioned at the driver’s right ear reflect the extent to which mechanical vibrations are transmitted into the vehicle interior as air noise. The following chart in Figure 9 shows the frequency spectrum from 50 Hz to 1 kHz (red curve: Vehicle 1, blue curve: Vehicle 2) when the vehicles were driven over an impact bar at 20 km/h.
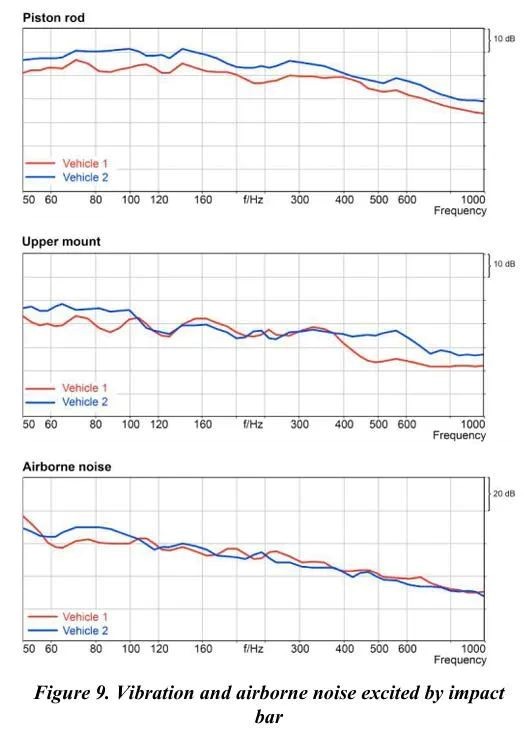
The mechanical vibration levels at the piston rod and upper shock absorber mount, as well as the air noise levels of both vehicles, exhibit similar frequency patterns. In the 60–200 Hz frequency range, lower levels were measured on the piston rod of Vehicle 1. Based on experience with conventional vehicles, a mechanical vibration isolation effect of 20 dB at the upper shock absorber mount can be rated as excellent. In the 60–400 Hz frequency range, Vehicle 2 showed lower measurement levels, indicating superior mechanical vibration isolation. Inside the vehicle, this translates to lower air noise levels for Vehicle 2.
5.3 Comparison of Two Groups of Shock Absorber Variables
In this section, the measurement results of vehicles equipped with original and optimized shock absorbers are compared. The task of optimization is to demonstrate the potential for improving vehicle vibration behavior. All applied countermeasures can be divided into two groups:
(1)Optimization of dynamic damping force characteristics;
(2)Structural optimization of shock absorber assemblies.
To optimize the damping force characteristics, newly developed valve systems were used. The degenerative behavior of the force/velocity characteristics was mitigated, and the structures of the shock absorbers and mounts were adjusted and optimized. The structural optimization aims to shift the natural frequency of the shock absorbers away from critical positions in the vehicle’s key areas.
5.3.1 Vehicle Measurements
Comparisons of vehicle measurement results demonstrate the distinct advantages of the optimized shock absorbers. The average frequency spectrum of piston rod acceleration (Figure 10) shows that the amplitude of the optimized shock absorbers is reduced by up to 5 dB. The excitation of the vehicle body is significantly minimized, particularly within the critical noise frequency range. Figure 10 also presents the frequency spectrum of acceleration at the upper mount, highlighting that the optimized shock absorbers significantly improve the acoustic performance of the passenger compartment compared to the baseline.
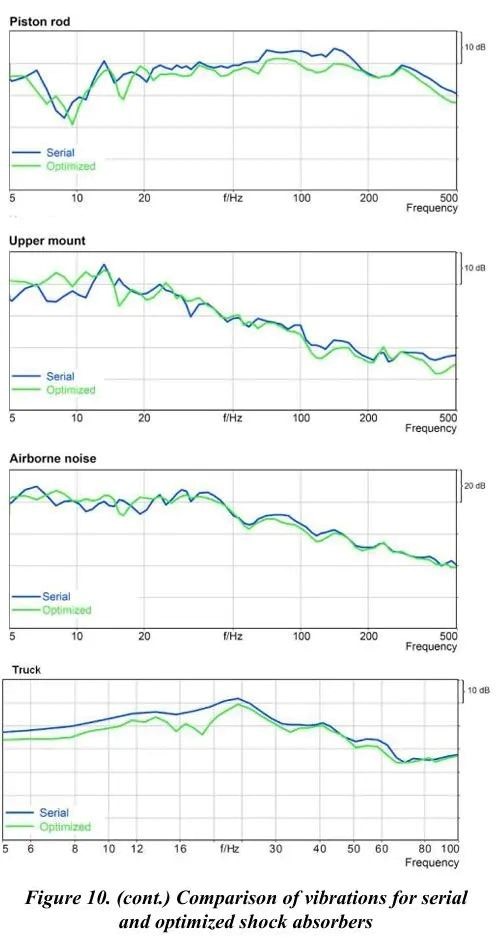
No significant changes were measured in the vibrations at the shock absorber mount (wheel vibrations), indicating that the new shock absorbers have no defects in terms of driving safety.
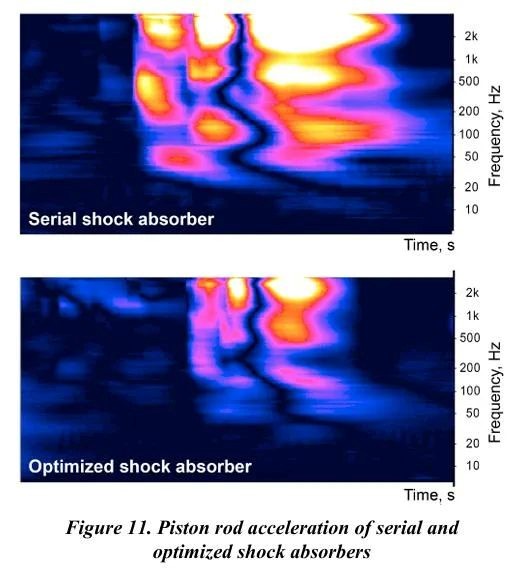
Through speed bump tests, the optimized shock absorbers demonstrated significantly higher vibration damping than the original ones. This is clearly evident from the analysis of the piston rod acceleration frequency spectra (e.g., Figure 11 for the rear axle shock absorbers).
The results show a high degree of body height decoupling and a significant reduction in unpleasant vibrations, which is confirmed by the average frequency spectra of the seat track acceleration and microphone signals (Figure 10).
5.3.2 Tests on the Measurement Bench
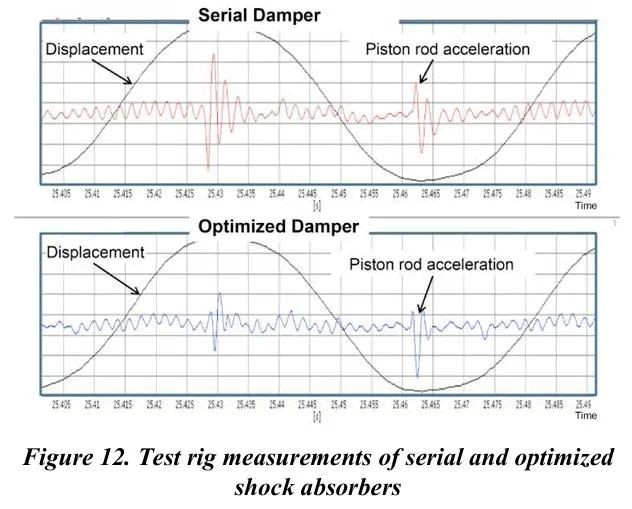
Dynamic measurement comparisons conducted on the test bench show that shock absorbers with optimized valve system designs exhibit significantly better vibration characteristics compared to the original shock absorbers in the vehicle. Under the same excitation within the characteristic frequency range of the axle, the optimized shock absorbers provide significantly lower vibration responses, characterized by the acceleration amplitude of the piston rod. Figure 12 shows a fragmentary example of the test bench measurements, displaying the time responses of shock absorber displacement and piston rod acceleration. There is good consistency between the measurement results on the test bench and those on the vehicle, enabling effective component optimization in the early development stage before test vehicles are available.
06 Conclusion
The spring-shock absorber system significantly influences a vehicle’s driving characteristics by transmitting vibrations from the chassis and drivetrain to the body, while also affecting its noise, vibration, and harshness (NVH) properties. This is particularly evident in electric vehicles (EVs) due to the absence of noise masking from internal combustion engines.
Through the presented study, a comprehensive analysis of chassis vibrations in EVs and their impact on driving comfort was conducted. Nonlinearities in the damping force characteristics were identified as the cause of noise and vibration occurrences. These nonlinearities convert low-frequency road excitations into high-frequency body vibrations and noise. As a specific feature of EVs, a greater separation between these noises and background noise was demonstrated.
By comparing EVs from two different original equipment manufacturers (OEMs), differences in vibration behavior were revealed. The use of NVH-optimized shock absorbers demonstrated the potential to enhance ride comfort, with reductions in noise and vibration of up to 5 dB achievable.
Component measurements using test benches enabled vibration optimization within a short timeframe. The insights gained and testing methods improved the efficiency of chassis component development.